
Live-Fiber Monitoring in Taiwan: 13 uFT iRFTS Deployments
Thirteen uFT iRFTS projects in Taiwan, 2010–2026: 308 monitoring units on 7,176 fiber cores. Architecture, live-fiber cutover, IPC vs MCU trade-offs, calculated power savings and vendor MTBF.
Most fiber faults are found the same way: a customer or a transport alarm reports an outage, and a crew goes out with a handheld OTDR to find the break. Remote fiber test systems (RFTS) move that OTDR into the station and keep it pointed at the cable all the time. This article looks at one such system, uFT iRFTS (intelligent Remote Fiber Test System), through its deployment record at Taiwan operators from 2010 to 2026, and at the design choices behind it.
All project figures, specifications and MTBF values below come from the vendor's presentation and deployment records. Customer names are withheld. Where we did our own arithmetic, we say so and show the assumptions.
13 projects, 2010 to 2026
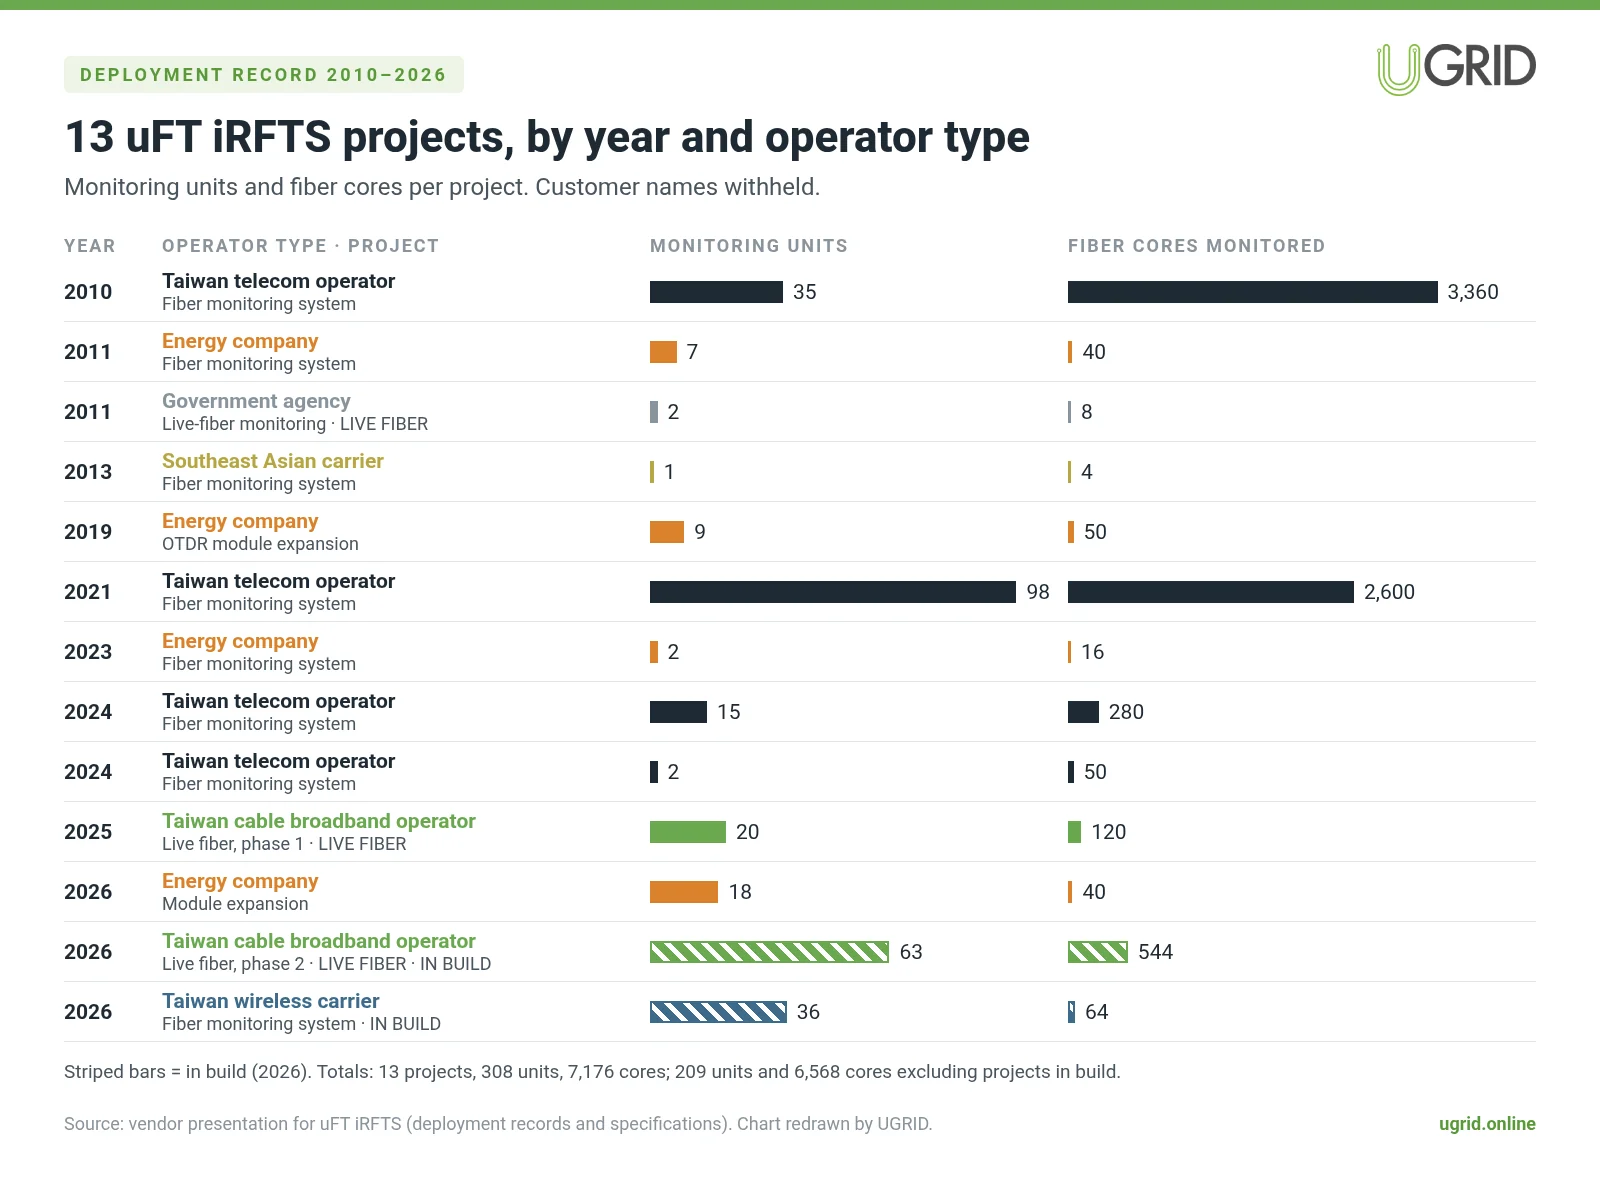
The deployment record lists 13 projects: Taiwan telecom operators, a Taiwan wireless carrier, a Taiwan cable broadband operator, an energy company, a government agency and one Southeast Asian carrier. Together they cover 308 monitoring units and 7,176 monitored fiber cores. Two 2026 projects (99 units, 608 cores) are still being built, so the completed total is 209 units and 6,568 cores.
| Year | Operator type | Project | Units | Fiber cores |
|---|---|---|---|---|
| 2010 | Taiwan telecom operator | Fiber monitoring system | 35 | 3,360 |
| 2011 | Energy company | Fiber monitoring system | 7 | 40 |
| 2011 | Government agency | Live-fiber monitoring | 2 | 8 |
| 2013 | Southeast Asian carrier | Fiber monitoring system | 1 | 4 |
| 2019 | Energy company | OTDR module expansion | 9 | 50 |
| 2021 | Taiwan telecom operator | Fiber monitoring system | 98 | 2,600 |
| 2023 | Energy company | Fiber monitoring system | 2 | 16 |
| 2024 | Taiwan telecom operator | Fiber monitoring system | 15 | 280 |
| 2024 | Taiwan telecom operator | Fiber monitoring system | 2 | 50 |
| 2025 | Taiwan cable broadband operator | Live-fiber monitoring, phase 1 | 20 | 120 |
| 2026 | Energy company | Module expansion | 18 | 40 |
| 2026 | Taiwan cable broadband operator | Live-fiber monitoring, phase 2 (in build) | 63 | 544 |
| 2026 | Taiwan wireless carrier | Fiber monitoring system (in build) | 36 | 64 |
Two patterns stand out. Early telecom projects monitored many cores per unit (3,360 cores on 35 units in 2010; 2,600 on 98 units in 2021), which is consistent with dark-fiber monitoring of large backbone cables. The cable broadband projects monitor far fewer cores per unit (120 on 20 units, then 544 on 63), which is consistent with live-fiber monitoring, where each monitored fiber carries traffic and needs its own WDM and power-monitoring path.
How the system is put together
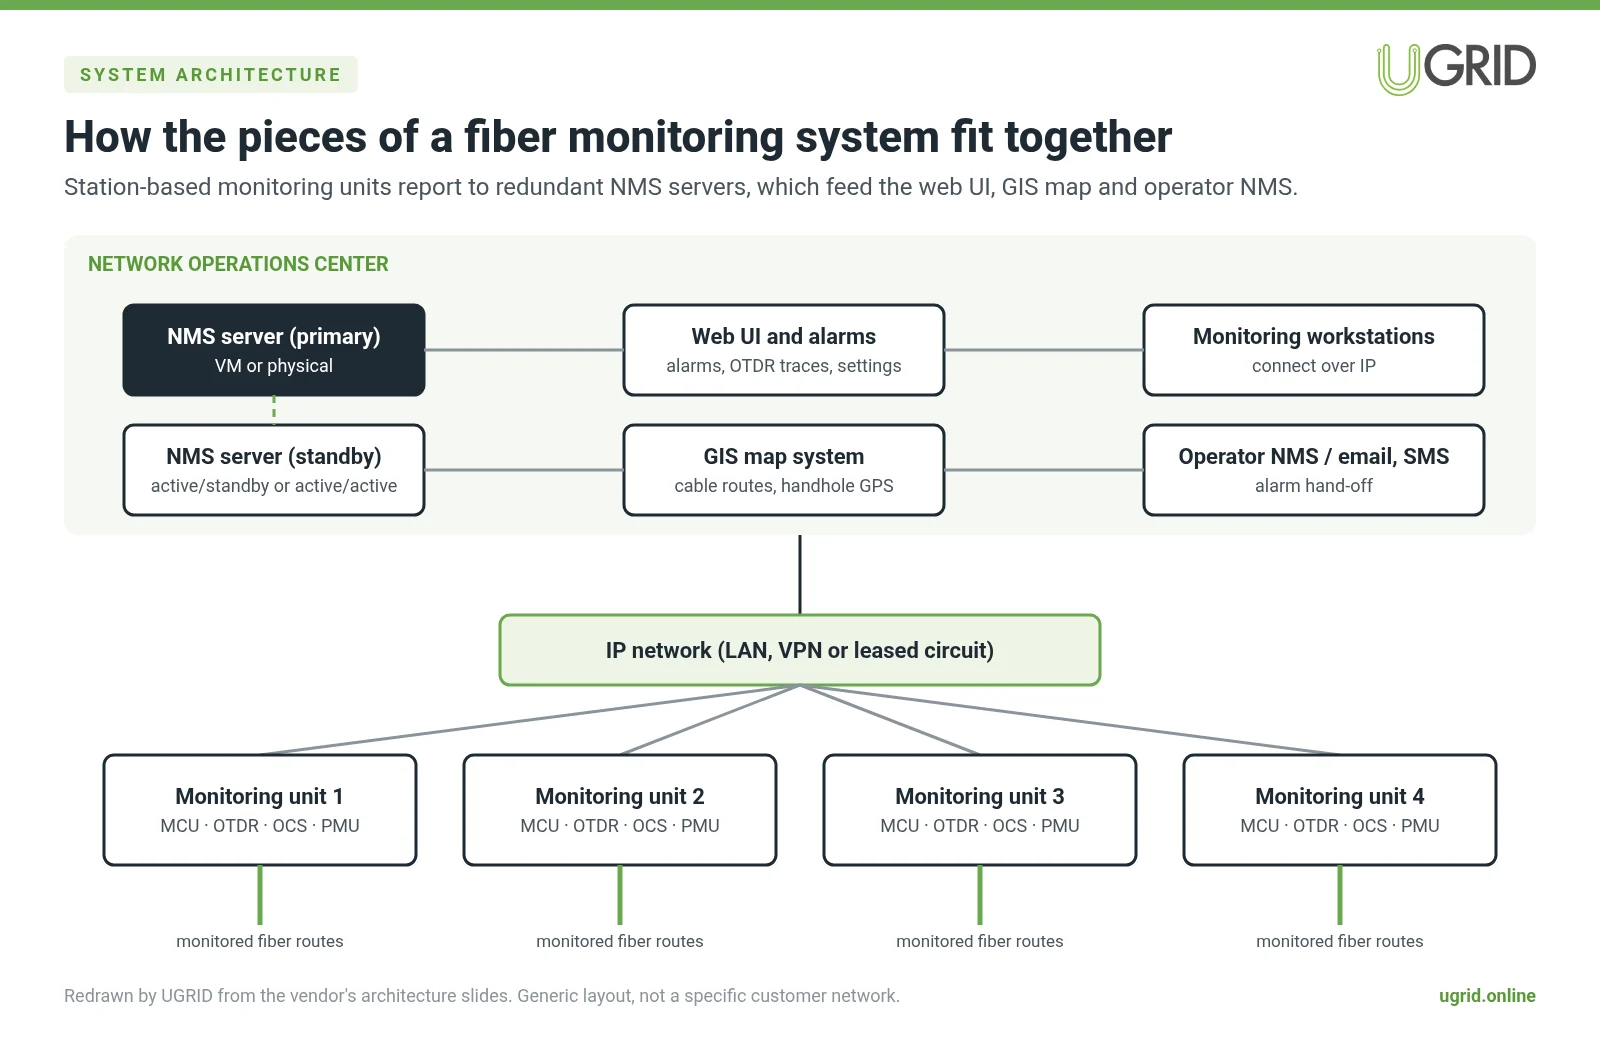
A monitoring unit sits in each station. It holds an OTDR module, an optical channel selector (OCS) that switches the OTDR between fibers, power monitor units (PMU), WDM modules, a power supply and a controller. The units report over the IP network to a monitoring server in the network operations center. The server can run on a VM or physical hardware, in active/standby or active/active pairs. It stores and analyzes results and hands alarms to the web interface, a GIS map of the cable routes, monitoring workstations and the operator's own NMS.
Dark fiber vs live fiber
The older way to monitor dark fiber is polling: the OCS steps the OTDR through each port in turn. At one minute per fiber, a 48-fiber cable takes 48 minutes for one pass, so a break can wait most of an hour to be seen, and the OTDR runs all the time. The real-time dark-fiber mode puts a 1550 nm light source unit (LSU) at the far end and a PMU at the monitoring unit. The PMU sees the power drop immediately, and only then starts the OTDR to locate the fault.
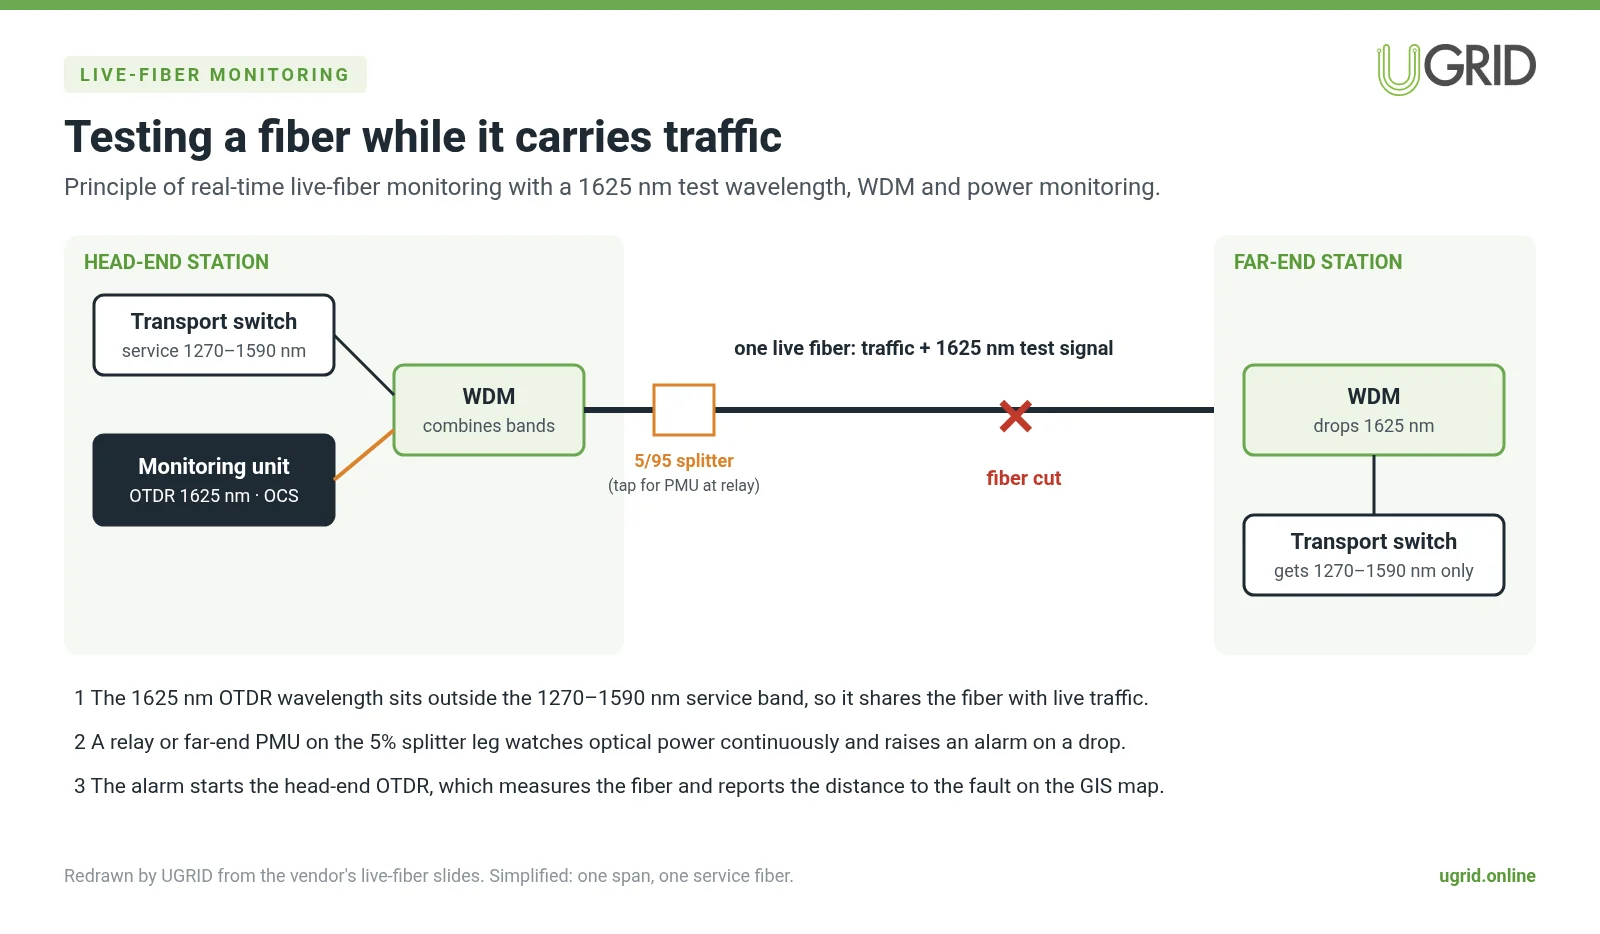
Live-fiber monitoring watches fibers that carry traffic. The monitoring wavelength is 1625 nm, outside the 1270 to 1590 nm band the transport equipment uses. A WDM at the head end adds the 1625 nm OTDR signal to the live fiber, and a WDM at the far end removes it before the transport switch. A 5/95 splitter feeds a small share of light to a PMU at a relay or far-end site. When a cut happens, the PMU alarm triggers the head-end OTDR, which measures the distance to the fault and shows it on the GIS map. The vendor's design notes cover head end to far end, head end through a relay, and a relay feeding several far ends, where the relay's OCS can switch the test path to the affected branch. The same approach applies on PON routes with ONTs at the far end.
Cutting live fiber over without an outage
Adding WDM and splitters to a fiber that already carries traffic means a short cutover. The vendor's construction plan uses five steps:
- Submit the system design, construction plan and detailed design (routing table, rack and frame layout) for approval.
- Apply for a live-fiber cutover window.
- Confirm the backbone transport has a backup fiber or backup communication path.
- Rehearse the backup path before the work, then install and power the unit and pre-patch all jumpers.
- Re-patch the live fibers through the WDM and splitter, then confirm the backbone link has recovered.
Why the controller design matters: IPC vs MCU
Older monitoring units were built around an industrial PC (IPC) running Windows. uFT iRFTS uses a microcontroller and DSP (MCU) running fixed firmware, with no general-purpose operating system on the unit. The vendor's comparison is below, including the two points where the MCU design gives something up.
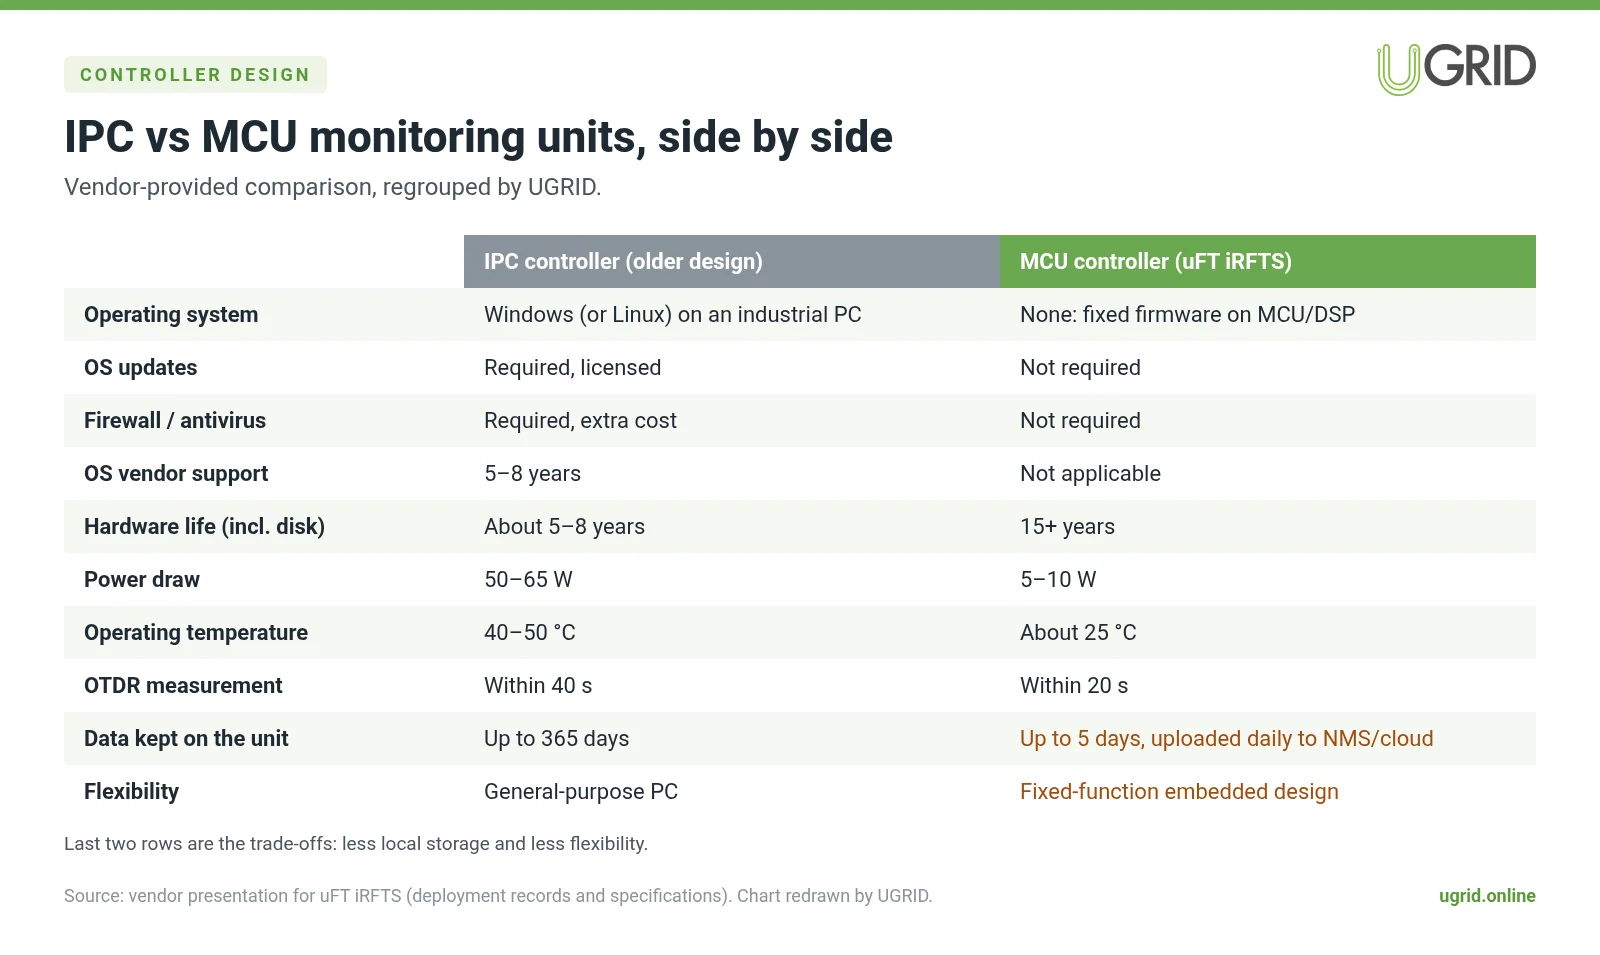
For an operator, the practical effect is fewer things to maintain at hundreds of unmanned sites: no OS patch cycle, no endpoint antivirus, and no OS end-of-support date forcing a hardware refresh. The trade-off is that each unit keeps at most about five days of data, so the design depends on the daily upload to the monitoring server or cloud. If that link is down for longer, data older than five days on the unit is lost. A fixed-function unit also cannot take on other software jobs the way a PC can.
What the power difference adds up to
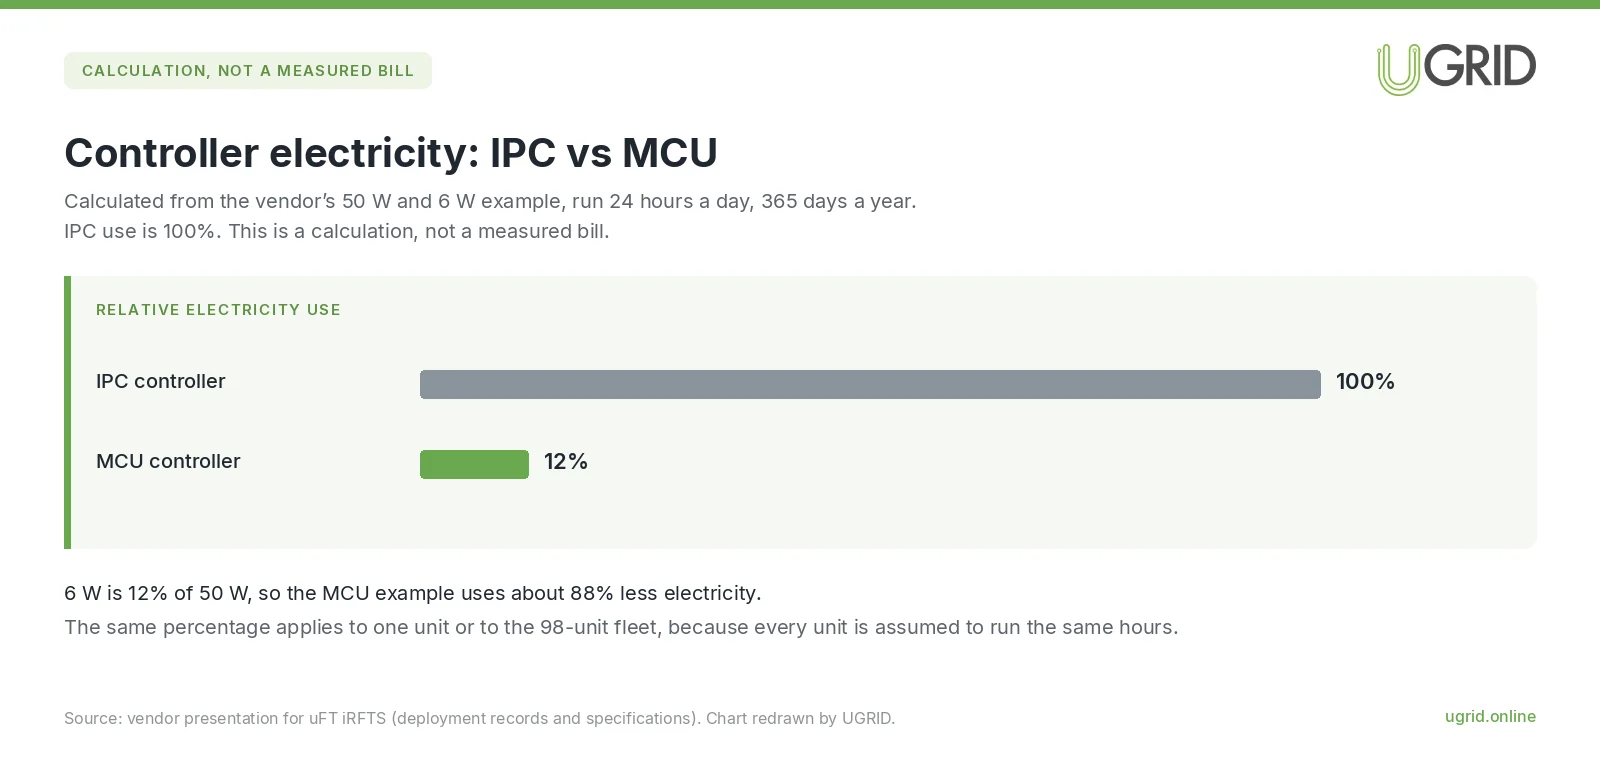
The vendor gives 50 to 65 W for an IPC controller and 5 to 10 W for the MCU controller, and uses 50 W and 6 W in its own example. We compared those two figures. This is a calculation of electricity use, not a measured bill. It assumes constant draw 24 hours a day, 365 days a year.
- IPC example: 50 W. Over 8,760 hours that is 438 kWh per unit per year, and 42,924 kWh for the 98-unit fleet in the 2021 project. Treated here as 100%.
- MCU example: 6 W. Over the same hours that is 52.56 kWh per unit per year, and 5,151 kWh for 98 units, which is 12% of the IPC figure.
- The MCU case uses about 88% less electricity, for one unit or for the whole fleet, because every unit is assumed to run the same hours. Lower power also means less heat in the rack: the vendor lists 40 to 50 °C for IPC units and about 25 °C for MCU units.
Reliability figures
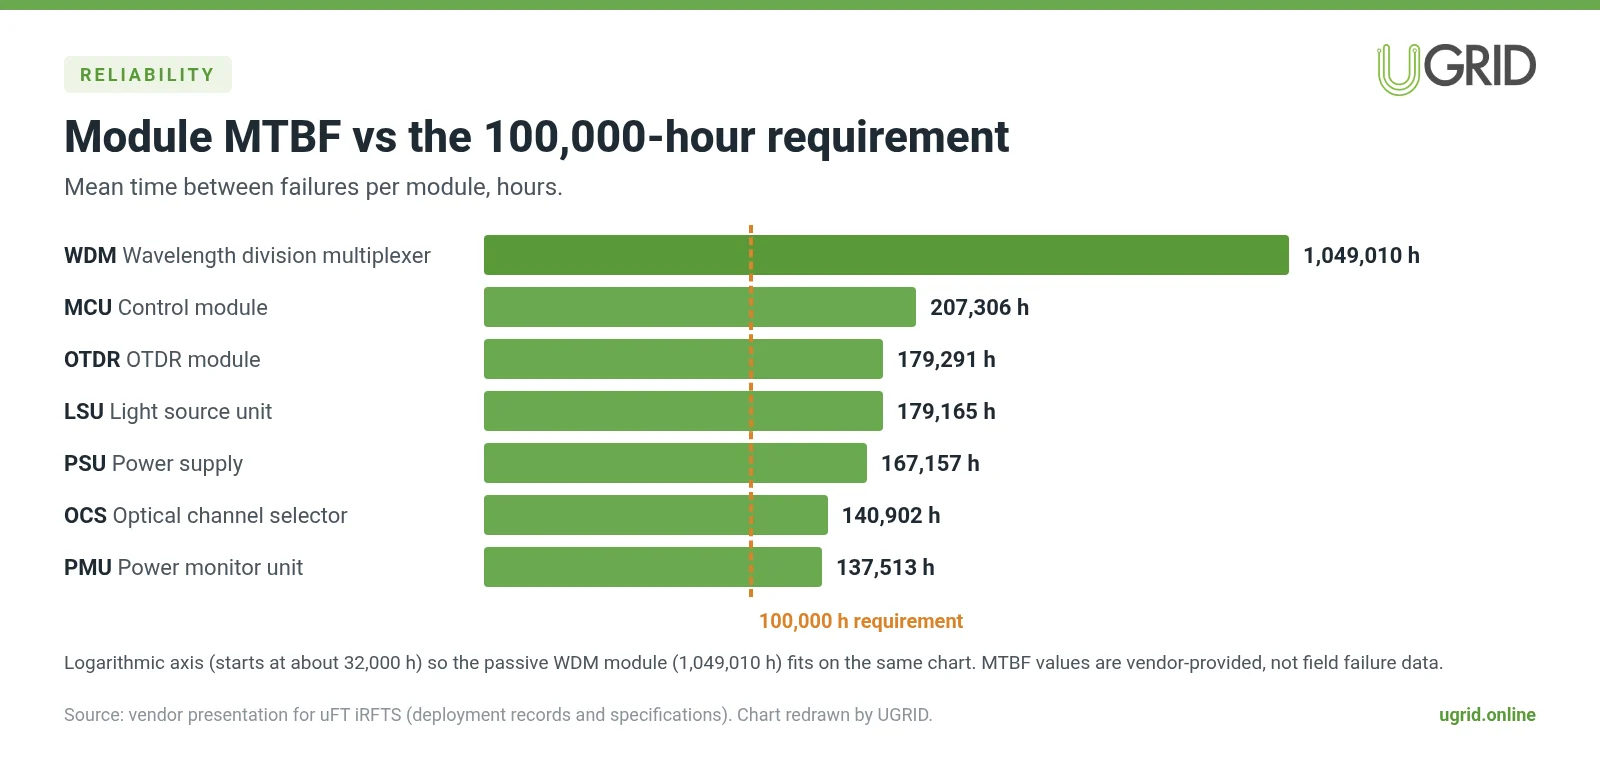
The vendor lists MTBF for each module against a 100,000-hour requirement. Every active module is between about 137,000 and 207,000 hours; the passive WDM module is over a million. These are vendor-provided MTBF figures, not failure rates measured in the field. The equipment is made in Taiwan, and the vendor states it is not a China-made or Chinese-brand product, which some operators require for core network equipment.
Operations features worth checking
- Web interface with login records, alarm list, manual OTDR measurement, OTDR trace and event table, unit settings and per-unit cable routes.
- GIS map with fault location, import and export of cable routes and handhole GPS coordinates, landmark management, and length equalization so map distance matches fiber distance.
- Emergency test port: the last OCS port can be set aside as an OTDR test port, so a crew can test a cable under construction or repair from the station without bringing an OTDR.
- Unmanned-site self-recovery: watchdog and IC self-check on the MCU, a server-side check of unit communication that tries a warm restart and then a cold restart, and a redundant power supply (one AC and two DC inputs).
FAQ
Can an OTDR test a fiber that is carrying traffic?
Yes, if the test wavelength is outside the service band. Here the OTDR uses 1625 nm, the traffic uses 1270 to 1590 nm, and WDMs at each end add and remove the test signal.
What is the difference between dark-fiber polling and real-time monitoring?
Polling steps the OTDR through each fiber, so a 48-fiber cable at one minute per fiber is checked once every 48 minutes. Real-time monitoring watches optical power continuously and starts the OTDR only when power drops.
Why does an MCU-based monitoring unit use less power?
It runs fixed firmware on a small embedded processor instead of Windows on a PC. Vendor figures are 5 to 10 W against 50 to 65 W.
What is the catch with an MCU unit?
It stores only about five days of data locally, so it relies on a daily upload to the monitoring server, and it cannot run other software the way a PC can.
The system in this record
Specifications are on the uFT Intelligent Remote Fiber Testing System page. The 2025–2026 cable broadband deployment is written up on its own: live-fiber monitoring at a leading cable MSO in Taiwan.
See the uFT-2U Product Page →Sources and notes
Data source: vendor presentation for uFT iRFTS (intelligent Remote Fiber Test System), including the deployment record, IPC vs MCU comparison tables, architecture and live-fiber design slides, construction plan and MTBF table. Customer names are withheld; operator types are given instead. The kWh totals and the 88% difference are UGrid's arithmetic from the vendor's 50 W and 6 W example. Charts and diagrams were redrawn by UGrid.